
The dataset was obtained from the Speed Dating Experiment dataset on Kaggle. The aim is to investigate the factors and biases influecing the choice of the individual participating to the speed dating sessions.
From the Kaggle dataset description:
This dataset was compiled by professors Ray Fisman and Sheena Iyengar for their 2006 paper Gender Differences in Mate Selection: Evidence From a Speed Dating Experiment.
Data was gathered from participants in experimental speed dating events from 2002-2004. During the events, the attendees would have a four minute “first date” with every other participant of the opposite sex. At the end of their four minutes, participants were asked if they would like to see their date again. They were also asked to rate their date on six attributes: Attractiveness, Sincerity, Intelligence, Fun, Ambition, and Shared Interests.
The dataset also includes questionnaire data gathered from participants at different points in the process. These fields include: demographics, dating habits, self-perception across key attributes, beliefs on what others find valuable in a mate, and lifestyle information.
Preliminary exploratory data analysis reveals missing data for most columns.
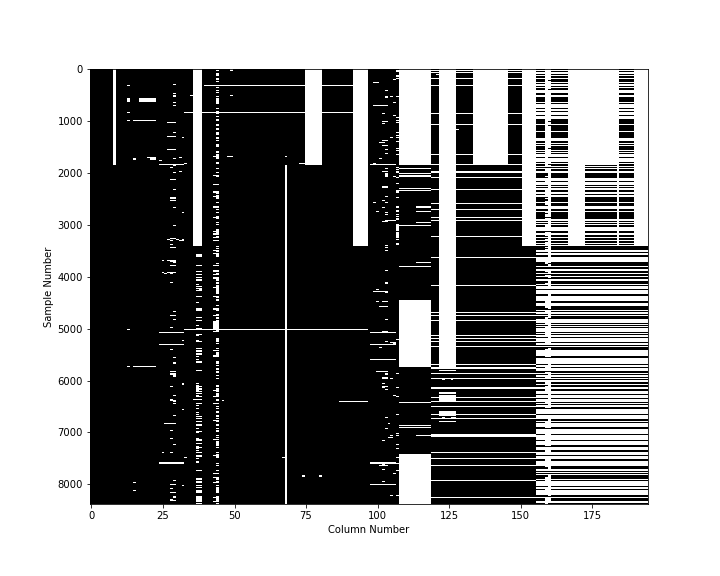
Data cleanup includes removing columns with too many missing values and/or of little value:
positin1the positiong of the individul during the event, 22% missing valuesundergraschool attended for undergrad, 41% missing valuesmn_sattheir SAT score, 63% missing valuestuitiontuition listed for each response toundergradin Barron’s 25th Edition, 57% missing valuesfromwhere they are from, 1% missing valueszipcodetheir zip code, 13% missing valuesincomemedian household income based on zipcode, 49% missing valuesexpnumtheir expected number of matches, 79% missing values
More columns are removed because the data even if potentially of interest, they miss a lot of data as they relate to questions in the survey with a low rate of completion (the questions are asked moments or days after the speed meeting event).
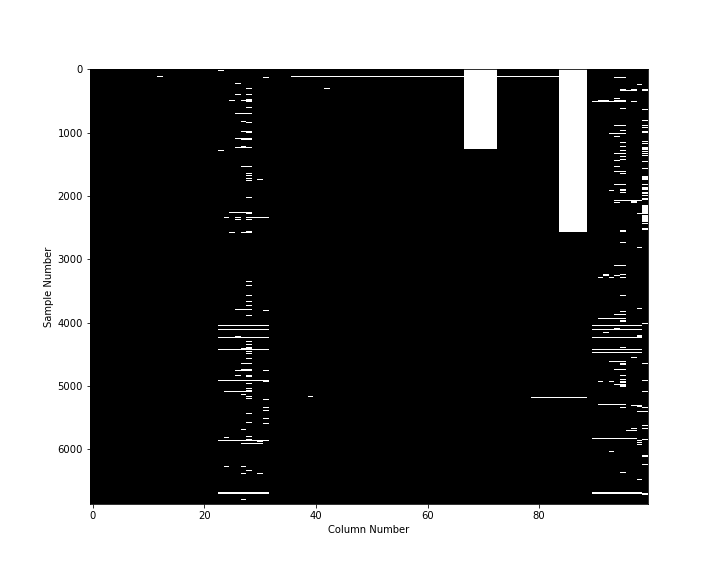
Finally, we remove the participants that were given limited choice, with missing ids, with missing age and race, and where it’s appropriate, missing values are filled in with the median or with zeroes.
The cleaned up data looks like this, with all demographic data (left of the graph) complete.
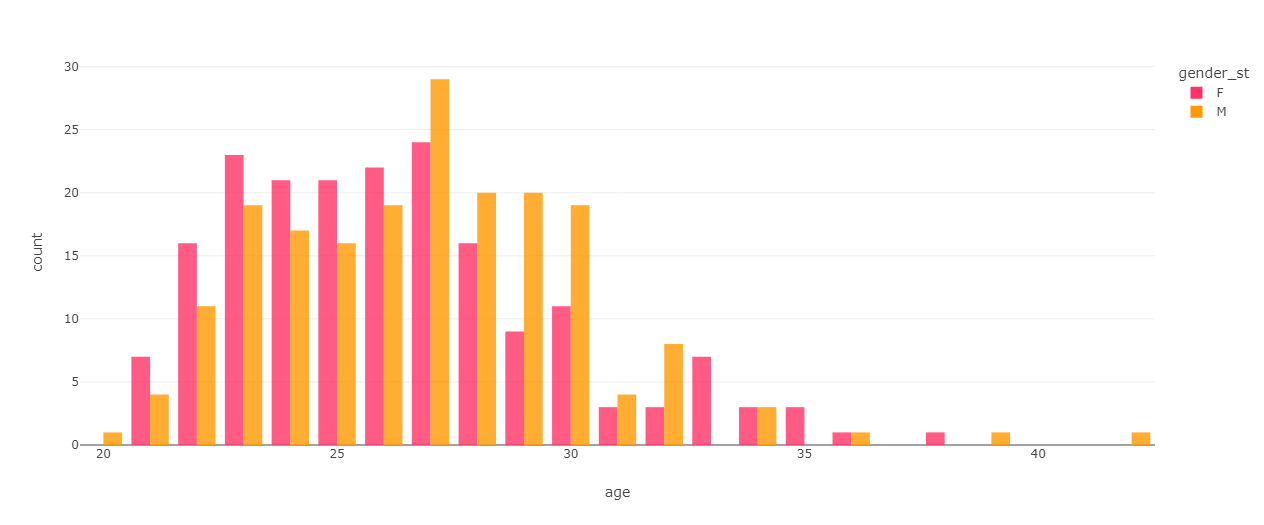
The analysis of the age distribution of participants shows a median age of 26 for females and 27 for males, which is unsurprising given the experiment took place at Columbia University.
Plotting the age distribution of of participants against their partners as a function of the decision of the partipant to match (1) or not (0), shows that there isn’t an evident correlation between age and the decision of participants. Because of the relatively young pool of this experiments, these results cannot allow to draw conclusion about the general population.
Analysis the race of participants shows that the majority of partipants of both genders are caucasians, and that the proportion of BIPOCs is slightly higher in women.
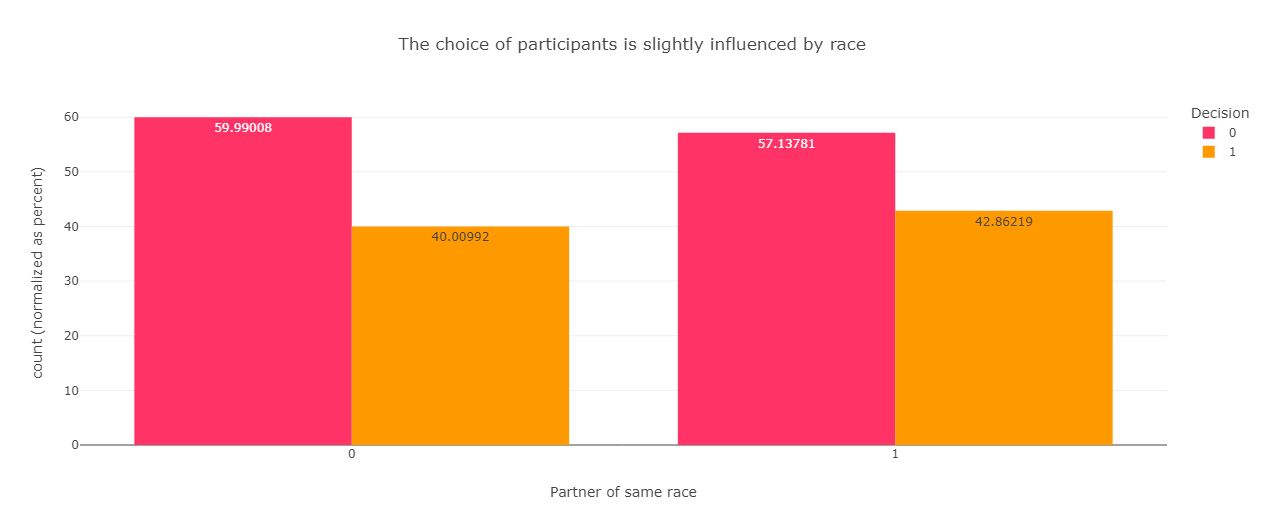
A first glance at the decision of participants if their date is of the same race, reveals a small bias towards date of the same race.
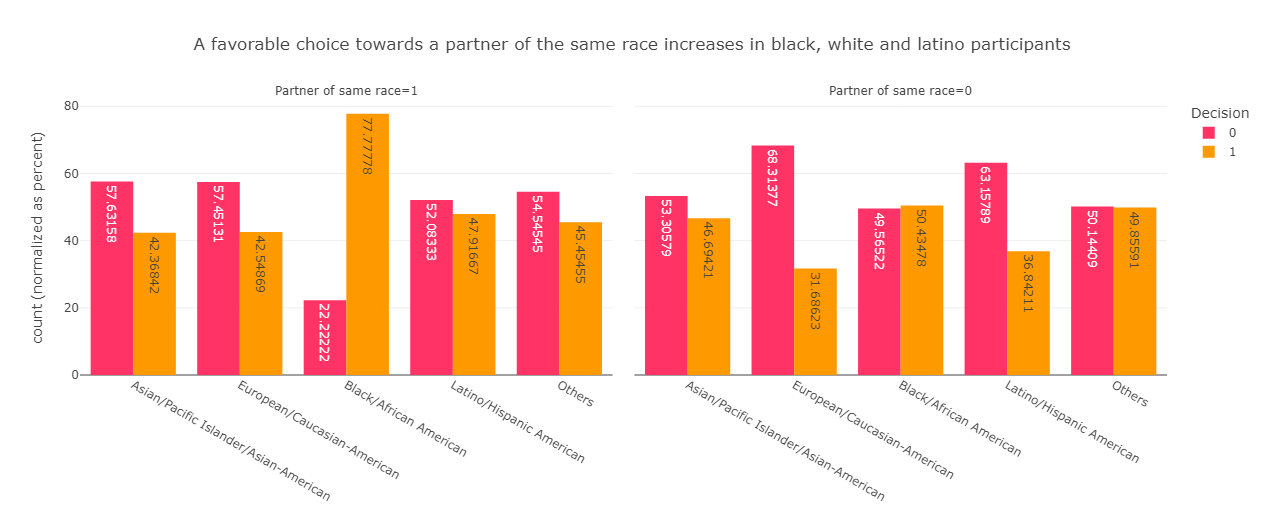
A breakdown based on the race of participants shows that a positive bias towards dates of the same race exists for caucasian , black and latino and latina participants, whereas a negative bias is presents in asian participants.
Obviously, other factors besides age and race influence people’s choices in dating.
The dataset gathers data about people’s interest in different activities and topics (sport, watching sports, exercise, dining out, museums, art, hiking, gaming, clubbing, reading, watching TV, theater, movies, concerts, music, shopping, yoga) and calculates an interest correlation between participants. Analysing the interest correlation in relation to whether the date results in a match shows that, indeed, sharing interests significantly increase the chances to match.
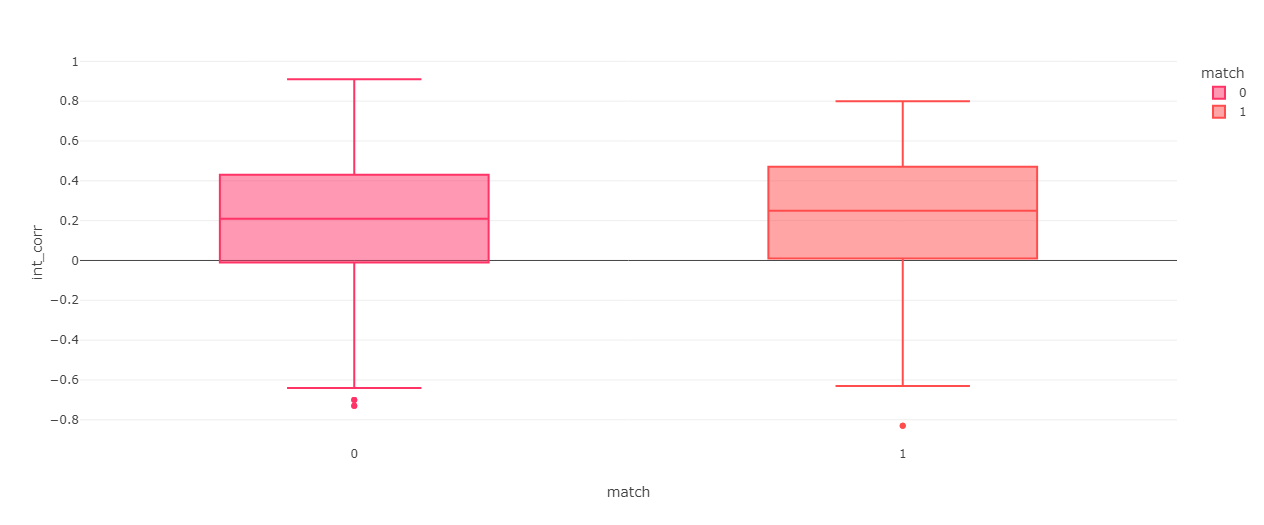
Average interest correlation for matches: 0.226
Average interest correlation for missed matches: 0.197
The difference is very significant (p<0.01)
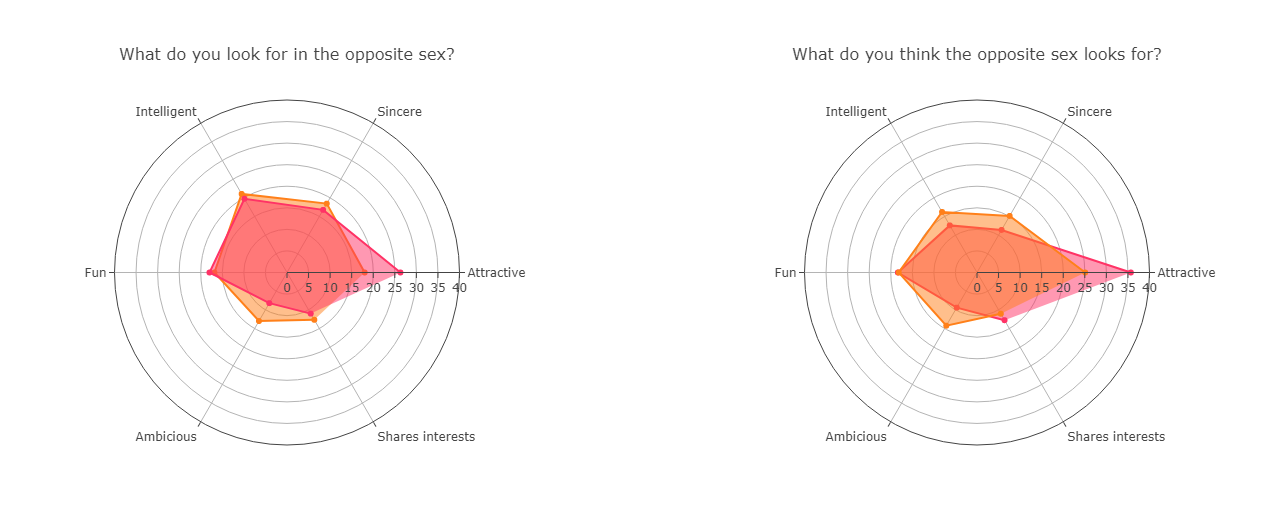
Finally, personality and looks matter too. Participants are first asked what they value in a partner and what they think the opposite sex looks for. Males (pink) report value attractiveness, followed by intelligence, honesty and a fun personality, while females (orange) seems to appreciate all these qualities somewhat equally.
On the other hand, when participants are asked what they expect the opposite sex to look for, both overestimate attractiveness (especially females in males, pink), but they predict the importance of a fun personality.
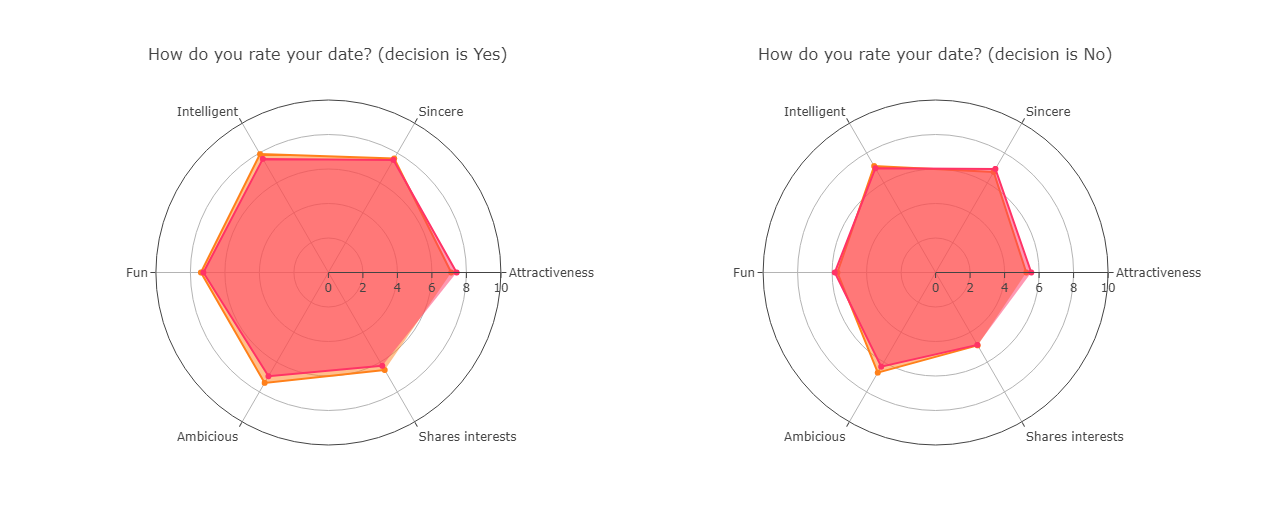
Ultimately, when participants are asked to rate their date, regardless of gender, chosen dates score high on all fields (attractive, honest, fun, intelligent, ambicious and shares interests). So maybe participants are right, an attractive partner matters but attractiveness is not looks but is a whole package of qualities. When we like someone we like everything about them, at least at first glance!
In conclusion, in dating we should let go of our internal biases, and while being good looking might matter, cultivating other qualities matters most.